Blog dedicated primarily to randomly selected news items; comments reflecting personal perceptions
Tuesday, July 12, 2022
Wonder of Wonders -- Behold the Universe!
"From the data I've seen so far, from the work we've seen in
commissioning and then this first week of science, yeah, this is going
to be revolutionary."
"These are incredible capabilities we've never had before."
Jane Rigby, Webb operations project
manager, Goddard Space Flight Center, Greenbelt, Maryland.
"Those releases represented five days of observation with this
observatory."
"And they include something that is a deeper infrared image than has
ever been taken in history, deeper than Hubble images that required
weeks to acquire. That was done in half a day with Webb."
Randy Kimble, Webb project scientist, Goddard.
"I am so thrilled, and so relieved."
"It's just impossible
to convey how hard it really was. We risked so much to say we're going
to go do this, and it's so near impossible. But we did it."
John Mather, Nobel Prize
winner, senior scientist, Webb project.
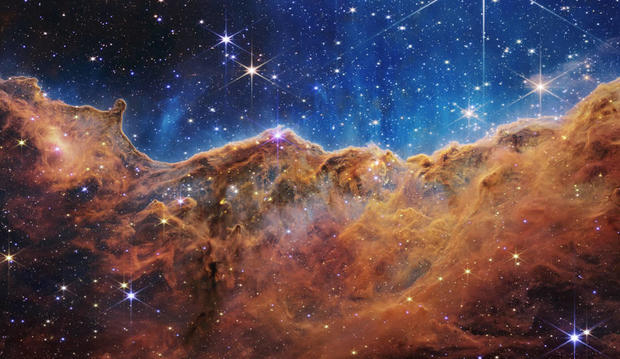
The James Webb Space Telescope's view of the Carina Nebula. NASA
Astronomers have awaited the results of the first photographs to be released, taken by the James Webb Space Telescope, the most powerful such telescope yet to search the Universe beyond our solar system, beyond our Milky Way Galaxy. The clarity of the photographs and the wide scope of far distant galaxies will in due time explain much about the Universe. Photographs are now being seen that reflect the birth and death of stars, nature's most mysterious secrets now on the verge of being unlocked through observation of what could never be imagined might be possible to analyze.
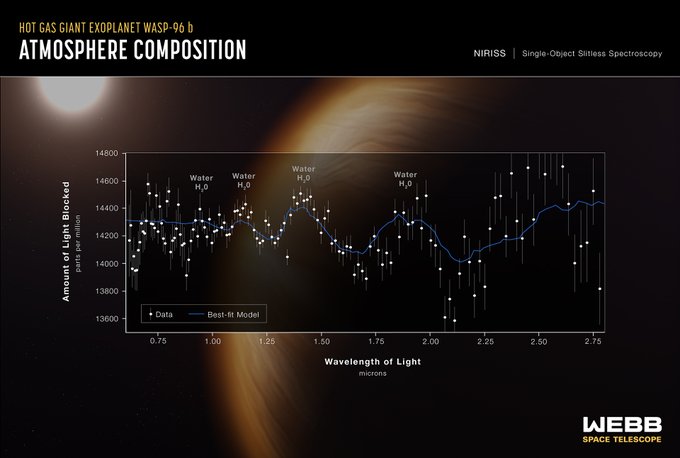
Clouds on another world.
@NASAWebb
Webb captured the signature of water on giant gas planet WASP 96-b, which orbits a star 1,150 light-years away. For the first time, we've detected evidence of clouds in this exoplanet's atmosphere: http://nasa.gov/webbfirstimages#UnfoldTheUniverse
"[The initial deep look unveiled on July11 is] proof of concept ... whetting our appetite for the record-breaking results we now know will come from this exceptional facility."
Heidi Hammel, planetary astronomer, scheduled to use the Webb
"[The telescope, the successor to the Hubble which is still in operation] has capabilities that far surpass my most optimistic dreams."
"The capabilities of Webb are truly out of this world."
Garth Illingworth, astronomer, University of California, Santa Cruz
A world-achievement, expectations were high for the success of this new eye in the sky that would send back messages and photographs from the most distant areas of the Universe. And what was revealed in those exceptional photographs of never-imagined detail was beyond extraordinary and exciting beyond measure to the fertile, now febrile minds of the world's greatest astronomers and astrophysicists. The $10-billion investment in the James Webb Telescope sent the world of space science into orbit yesterday.
The first image to be revealed at the White House is that of a cluster of galaxies called SMACS 0723. which only the massive lens of the Webb could have penetrated and portrayed so stunningly. Behind the magnification of the cluster are seen faint objects of vast cosmic distance. The "highest resolution images of the infrared universe ever captured", in the words of the American president who presided over the unveiling of the images.
Stephan's Quintet Credits: NASA, ESA, CSA, and STScI
The European Space Agency and the Canadian Space Agency partnered with NASA, maintaining a close grasp on the first images derived from the Webb during its initial sequence of observations as it orbits the sun a million miles from Earth. A few testing-phase images of the telescope were previously released, astounding astronomers with their detailed clarity. The newly-released photographs, however, were in full colour.
This initial first scrutiny deep into the universe by the Webb has excited the appetite of the world of astronomy for what is yet to come; revolutionary views of the universe crossing cosmic distances with unrivalled resolution. The coming months will transform what is currently known and assessed as an expansion of the understanding of the most basic rules and origin of the universe will gradually be resolved.
Now the formation of the earliest galaxies will be enabled by the Webb toward more intensive study along with the evolution of the expanding universe. Even our own solar system, hosting small worlds we hardly are aware of beyond the orbit of Neptune will come under scrutiny as nature's genius is examined and understood in time and space.
Arctic sea ice is like the fabled canary in a coal mine when it comes
to global warming. The far north is very sensitive to changes in
climate, with temperatures that fluctuate more than the southerly
latitudes.
The extent of (that is, area covered by) Arctic sea ice has been declining of late,
as has its volume (which includes the thickness). This is true no
matter what time of year you look; compare the maximum extent it reaches
in winter today with what it was, say, 20 years ago and you can see
it’s smaller. The same is true for the minimum extent in summer. This
steady melting away of ice is a clear indicator of a warming planet.
However, 2012 was an exception ... in that the amount of Arctic ice fairly well plummeted, dropping far below average.
Why? Scientists think they’ve figured that out, at least partially. And
not unexpectedly, when the ice shrank away, a denier claim grew.
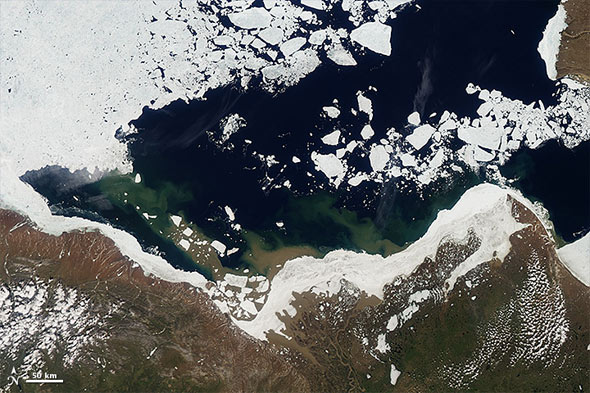
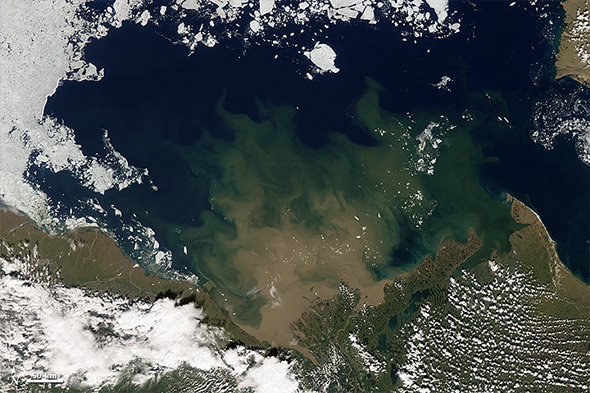
The images above
are from NASA’s Aqua satellite, and they show natural-color shots of
the Mackenzie River in the Canadian Arctic. Flowing north, its delta
leads to the Beaufort Sea, which has copious ice floating in it in the
winter. The two pictures are shown with a slider bar in between; move it
back and forth to see the “before” shot (taken on June 14, 2012) and
the “after” shot (taken on July 5, 2012) (Note: If you are using a
mobile device you may see the images stacked vertically with no slider.
If no images appear at all, click here to see them.)
In the “before” picture (moving the slider all the way to the right),
you can see lots of ice in the water. Note, though, the ice piled up
along the coastline. You can see the muddy water pooling in fingers
stretching toward the water. That ice acted as a dam, holding the water
back.
In the “after” picture (slider to the left) the dam is gone, and you
can see the river water infiltrating the sea—the brown swirls are
sediment washing out into the sea. Sometime in the intervening weeks the
warm river water melted the ice dam and broke through, flooding the
sea. This sudden infiltration of warm water raised the temperature of
the sea considerably, melted the ice floating beyond.
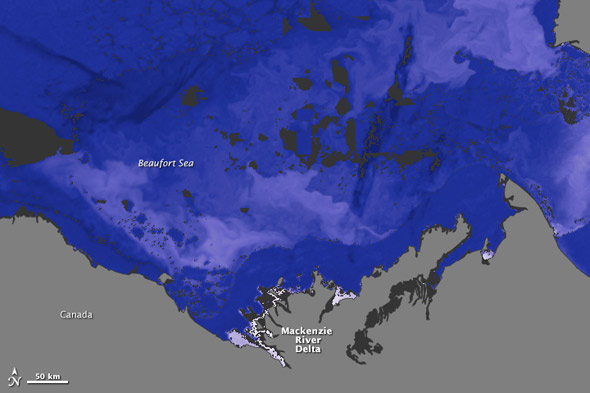
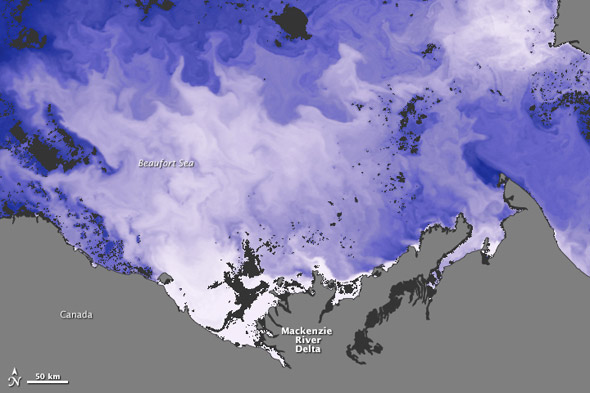
Aqua has detectors that can see microwave energy, which allows the
surface temperature of the water to be taken. Here is the same region,
this time showing the temperatures before and after the flood.
(Click here if you don't see the images.)
The darkest blue is cold water/ice at about -2° C, and white/lavender
is +15° C. As you can see, in just a few weeks the temperature went up
substantially; in some places it went up about 15° Celsius, a huge increase in thermal energy; by my rough calculations it would far, far exceed the energy released by a nuclear weapon.
No wonder that ice melted.
Scientists think this is what contributed to the huge drop in Arctic ice that year.
If the water were to move into the sea more slowly (as it usually
does), then there would be time for its excess heat to radiate away into
the atmosphere or be dropped into deeper waters. Instead, the sudden
inundation due to the ice dam breaking dumped all that warmth into the
sea surface, where it could melt the ice.
That’s why 2012 saw record low ice in the Arctic. The next year,
things were more normal, and the ice extent and volume were more like
they had been in previous years.
Incidentally, the waters in the Mackenzie (and other Canadian rivers)
are warming up due to global warming as well. Coupled with thinning ice also due to warming,
this water is breaking up the ice more efficiently than in previous
years, which may be the overall reason ice is disappearing from the far
north (incidentally, there are no rivers flowing into the Antarctic
region, so the ice there is not affected in this way).
Rivers are efficient conveyors of heat, it turns out; just another
piece of the huge and complicated puzzle that is global warming.
Scientists studying these effects are finding more and more ways these
pieces all fit together, which is a good thing. The more we understand
how the planet is heating up, the better we’ll be at predicting what
will happen, and how we’ll have to deal with it.
Do you think Valentine’s Day is out of this world? Are you over the moon for science? So is Slate’s
astronomy blogger, Phil Plait. Last year he put together a gallery of
cosmically great photos of moon craters and colliding galaxies that just
happen to be in the shape of a Valentine heart. Since photos don’t die
like flowers or get stale like chocolate, we are republishing them
below. Happy Valentine’s Day.
The Universe loves us!
Well, not really. It’s more that natural events and forces create
cosmic shapes that we interpret through millennia of evolutionary,
psychological, and cultural adaptations.
But that’s hardly romantic. Don’t let stereotypes fool you:
Scientists are just as influenced by emotions as anyone else. And since
it’s Valentine’s Day, here is a bouquet of a dozen astronomical images
that fit the theme of the day, brought to you by telescopes, space
probes, and our weird brains that like to see hearts everywhere.
----
Click to embiggen.
Photo by NASA/JPL-Caltech/Harvard-Smithsonian CfA
Happy Valentine's Day from Spitzer Space Telescope! This is an infrared view
of a cloud of gas and dust called W5, part of a far bigger complex
shining 6,000 light years away in the constellation of Cassiopeia. The
resemblance to a valentine is remarkable.
What you're actually seeing here is an enormous star-forming factory
150 light years across. Deep in its heart—“heart”! Oh man, I kill me!—
massive, hot, and bright stars are forming. When they switch on for the
first time, they blast out a flood of ultraviolet light as well as a
fierce wind of subatomic particles. These eat away at the cloud from the
inside out, forming an enormous cavity. It's the edges of this cavity
that form the cosmic valentine … trillions of kilometers across.
Photo by Julien Girard
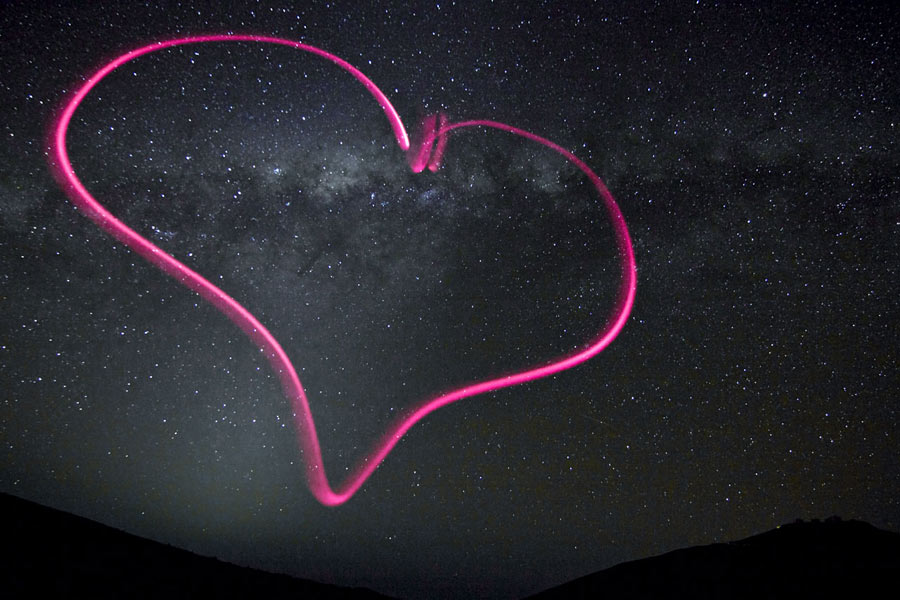
Photographer Julien Girard took this picture
of the Milky Way looming over the Paranal observatory in Chile, home of
the Very Large Telescope. During the 25-second exposure, he stepped
into the field of view and used a small flashlight to express his love
of astrophotography.
Click to enheartenate.
Photo by NASA/GSFC/Arizona State University
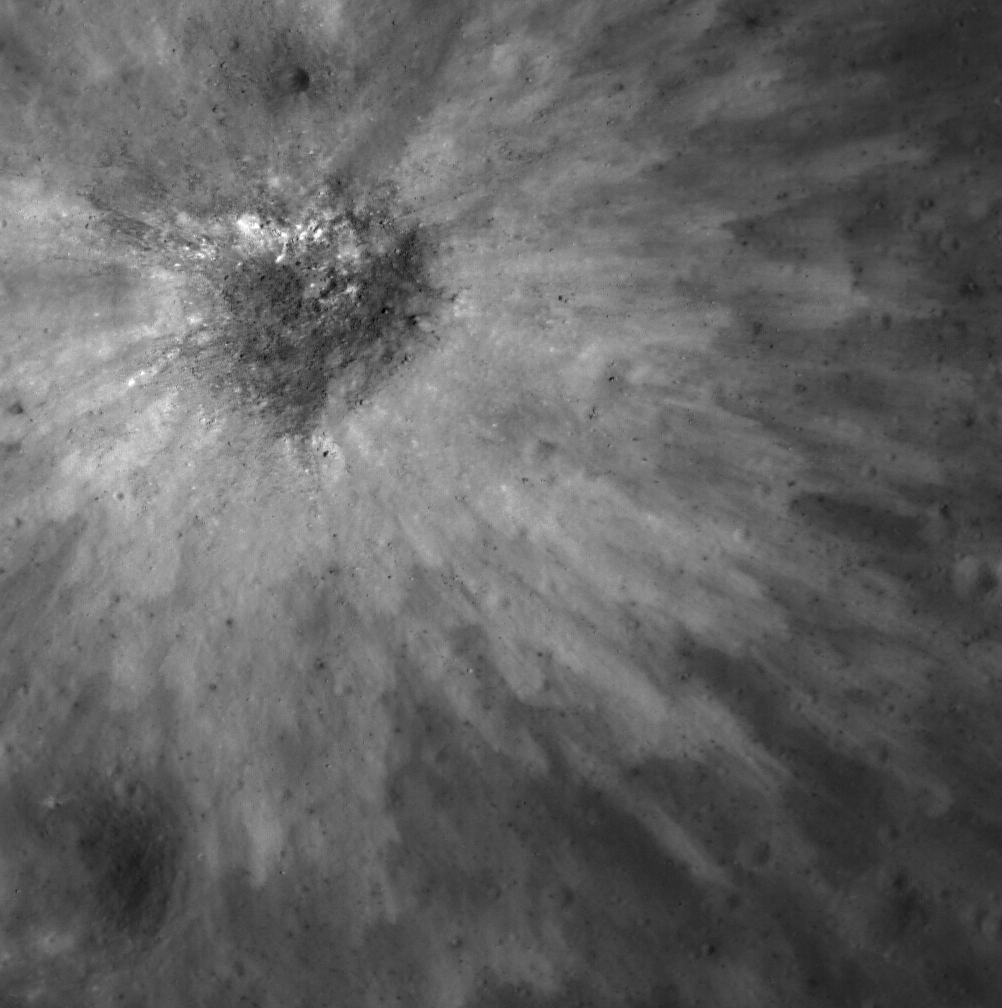
The full Moon is romantic, but if you zoom in on the right spot,
you can see our nearest celestial neighbor has its heart in the right
place. This 120-meter-wide crater may have involved a double impact of
some kind to get its valentine shape; perhaps a binary asteroid slamming
into its surface ages ago. The event excavated lighter-colored material
from under the surface, blasting it out over the older, darker surface
dust and rock.
Was it formed by two separate bodies held together by gravity, or one
that broke apart shortly before impact? It’s hard to say. Given the
valentine metaphor, I guess it depends on whether you’re a romantic or a
cynic.
Click to embiggen.
Photo by NASA, ESA, and the Hubble Heritage Team STScI/AURA)-ESA/Hubble Collaboration.
Acknowledgement: B. Whitmore (Space Telescope Science Institute) and James Long (ESA/Hubble).
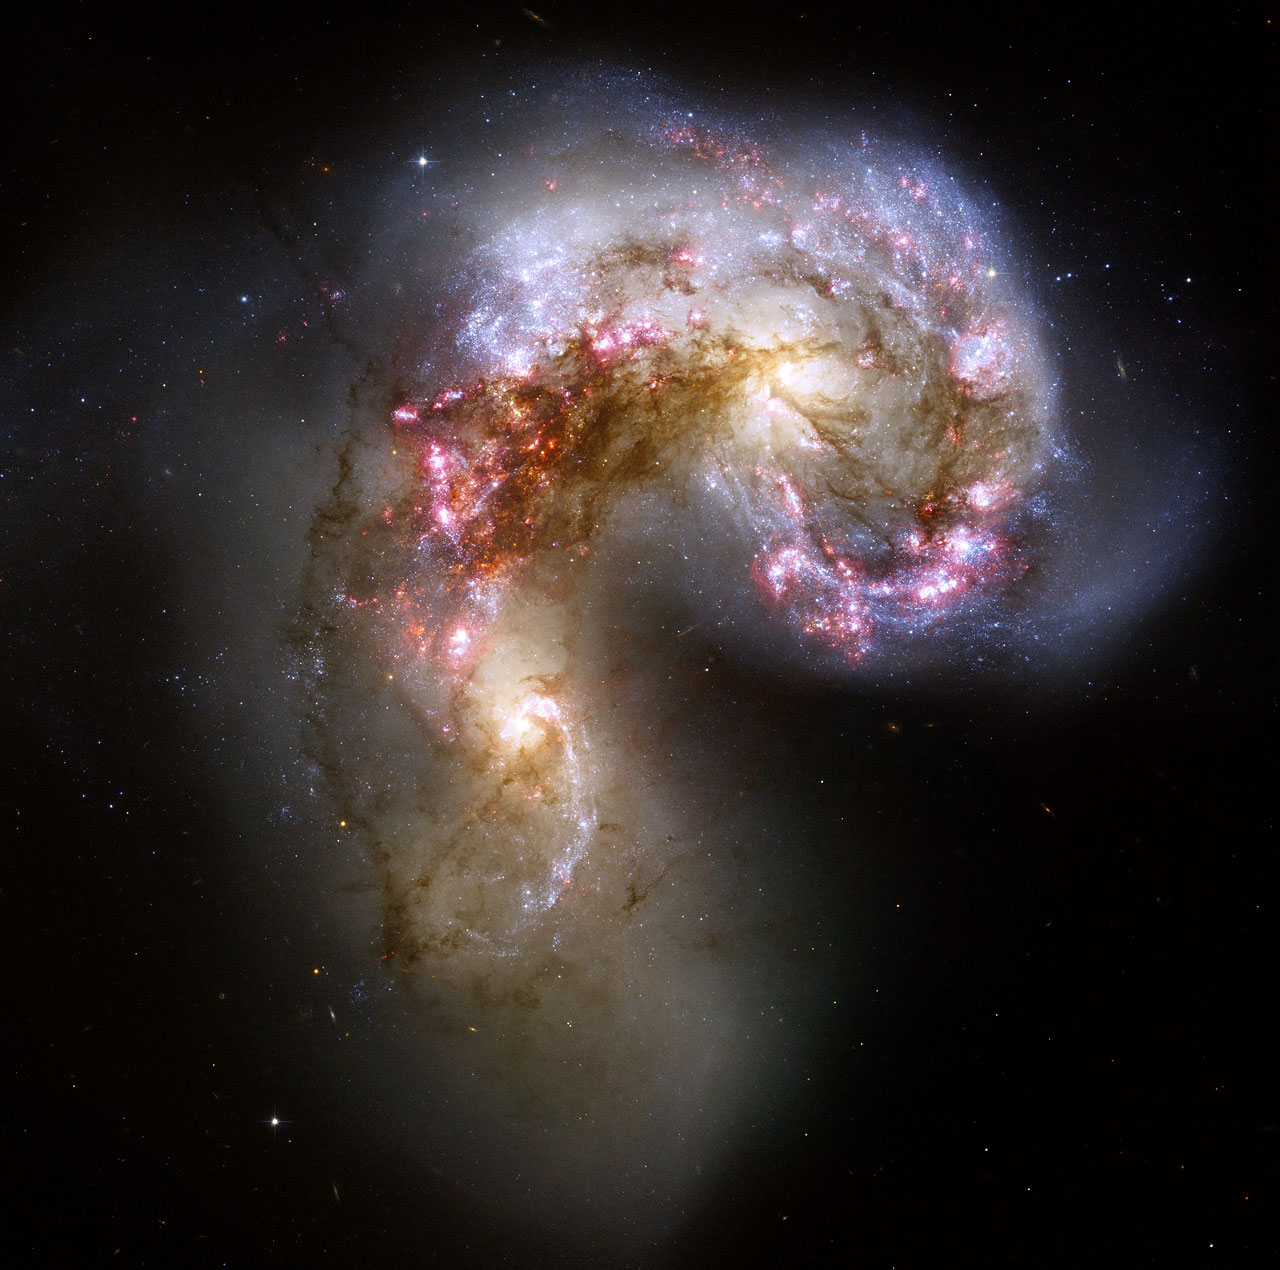
I know some folks with big hearts, but they don't even come close to the Antennae Galaxies: two colliding galaxies 45 million light years away and tens of thousands of light years across!
These were probably two normal spiral galaxies, not too much
different than our own Milky Way, when they began this celestial dance
millions of years ago. Their combined gravity twisted and distorted
their shape into what we see today.
Individual stars are too small to physically smack into one another,
but giant clouds of dust and gas are much bigger targets. When they
collide at these speeds (hundreds of kilometers per second!) they
compress, collapse, and undergo a burst of star formation. All those
pinkish clumps you see in this Hubble Space Telescope picture are
millions of stars being born.
Eventually the galaxies will combine, the two melding into one bigger
galaxy. A metaphor for Valentine's Day? Well, no, since the merger will
be a vast chaotic realm of high-energy outbursts, massive turbulence,
and an unpredictable future.
Oh, wait.
Click to Valentinate.
Photo by Malin Space Science Systems/NASA
In general, I would've thought valentine-shaped features on other
planets would be rare, but that's because I'm a cold-hearted,
calculating scientist. Turns out I'd be wrong, as this collage of pictures from the Mars Global Surveyor shows.
These are all either mesas (raised eroded features) or depressions on
Mars. My favorite has to be the perfectly-shaped, light-colored tiny
heart mesa at the bottom of the crater in picture R09-02121 at the upper
right. It's just adorable … even though it's roughly the same size as a
football stadium, and the event that formed it was an impact-generated
explosion similar to that of a nuclear bomb!
Eros: NEAR Project (JHU/APL); Mars: NASA/JPL/Malin Space Science Systems
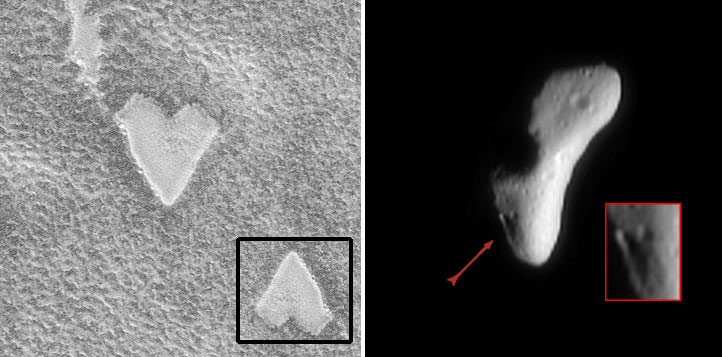
Here’s a twofer.
On the left, this lovely heart on Mars
is neither a crater nor a pit: It’s actually a mesa, a raised feature
on the surface. It looks like a pit in the big picture due to a
well-known illusion; if lit from below, a depression looks like a raised
feature, and vice-versa. I inset a flipped version of it, where you can
more plainly see it’s a mesa, not a depression. Fooling our brains is
easy to do with the right lighting and setting. Another Valentine’s Day
metaphor? Make of it what you will.
On the right is a cool coincidence. On Feb. 14, 2000 —yes, on
Valentine's Day—the space mission called Near-Earth Asteroid Rendezvous
(or NEAR) entered into orbit around the asteroid named 433 Eros. This
spud-shaped rock is 34 x 11 x 11 kilometers (21 x 7 x 7 miles) in size,
and sometimes approaches near the Earth (though we’re in no danger of it
hitting us).
Click to embiggen.
Photo by NASA/JPL-Caltech/UCLA
As NEAR approached Eros, it snapped this shot
of a feature at one end (I inset a zoomed-in picture on the lower
right). It's actually three separate craters, lit by the Sun in just
such a way as to resemble … well, you know.
And while it's a funny coincidence that NEAR went into orbit on
Valentine's Day, it may be an even better one that Eros itself is named
after the Greek god of love. Well, um, physical love, but you get the meaning.
Click to embiggen.
Photo by Malin Space Science Systems/NASA
This heart
may look like a crater on the surface of Mars, but it’s actually a
collapsed pit. It formed inside a long trough called a graben, a crack
or fracture that forms along fault lines.
This unnamed pit is about 2.3 kilometers (1.4 miles) across at its
widest point and appears to have quite a bit of sand and other windblown
debris on its floor.
If you look at the top left lobe, along the pit wall, you can see a
meandering darker streak with a boulder at the left end; it looks like
the rock must have rolled across the slope there, leaving that trail
behind. If this is some kind of metaphor for following a wandering path
to love, I leave it to you to find it.
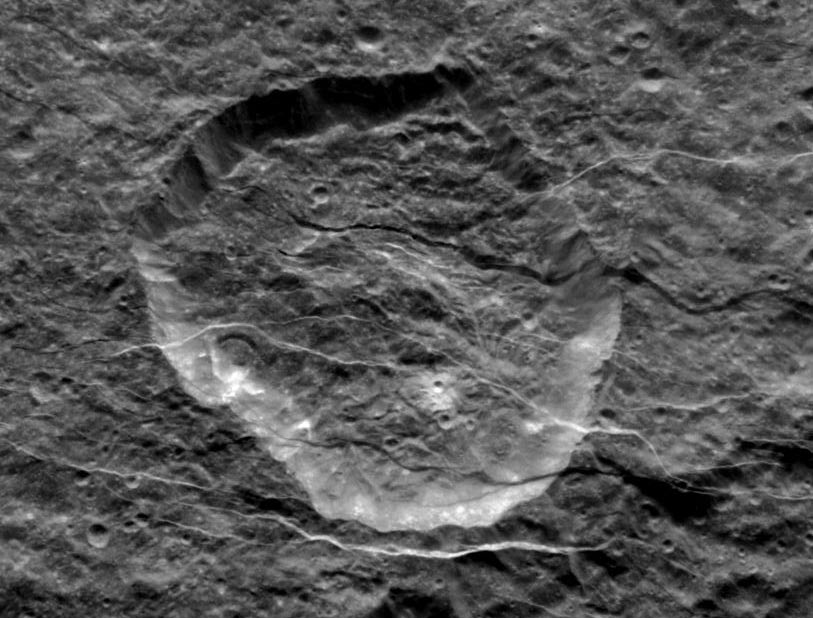
Photo by NASA/JPL/Space Science Institute
We've seen several features on the Moon and Mars shaped like hearts,
but this one may be a record for distance in the solar system: It’s on
Saturn’s moon Rhea, a ball of ice and rock about half the size of our
Moon and over a billion kilometers away! While it may look like a warm
sentiment, this heart on Rhea is so far from the Sun its temperature is
minus 175 C (minus 280 F), nearly cold enough to liquefy the nitrogen
and oxygen in our air. Better snuggle up!
Being a scientist, I have to say I approve of this infrared Spitzer Space Telescope image over all others: It’s actually
shaped like a real human heart. And I approve of the irony, too: It’s
located right next to the Heart Nebula featured at the top of this
gallery! They are both cavities carved out of the surrounding gas and
dust by the fierce light and winds of the young stars within, and
together they’re called the Heart and Soul Nebulae. Fittingly, this one
is the Heart, and the valentine-shaped one is the Soul.
Click to embiggen.
Photo by NASA/JPL/Malin Space Science Systems
This beautiful and nearly perfect heart is about 2 kilometers (1.2 miles) long and located nearly on the equator of Mars. The picture was taken by the Mars Reconnaissance Orbiter.
Like most valentine-shaped features on Mars, this is a collapsed
pit—you can see the ripple of sand dunes in the upper right part. It may
have formed eons ago when water just under the surface was
catastrophically released as a huge flash flood, causing the surface
above it to slump. It’s interesting how many ways this shape can be
formed on the surface of another world, and of course it’s purely
coincidence we associate it with love. Which is funny, given the god
Mars is actually named after.
Click to lovenate.
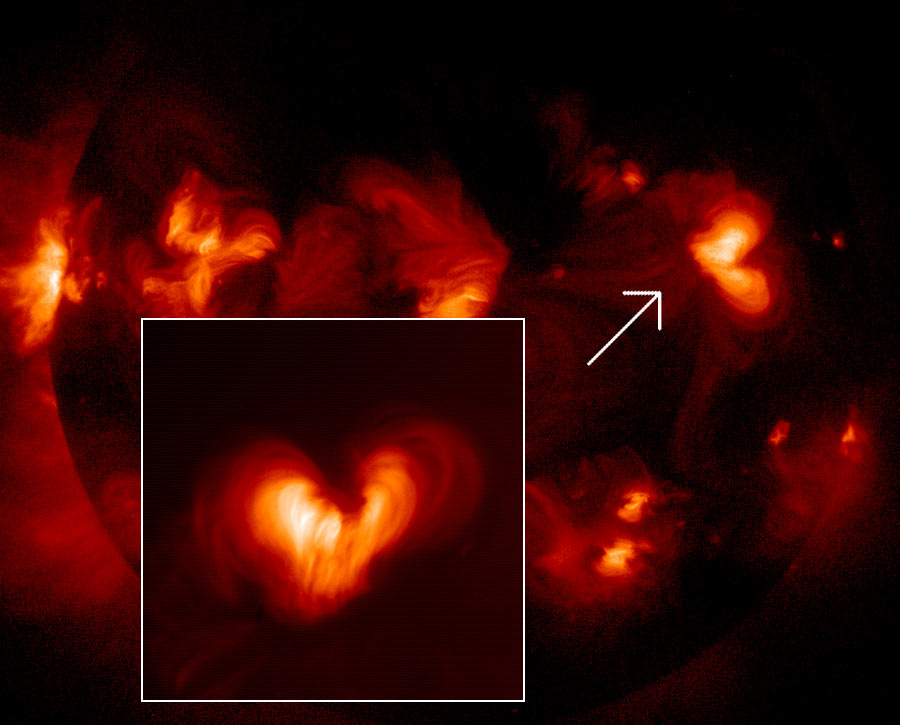
Photo by SAO/NASA/JAXA/NAOJ
What you see on the Sun depends on how you look at it. When you use a
telescope that can see X-rays, you can see the hottest features on its
surface, energized by the Sun’s complex magnetism. And, apparently, you
see that the Sun loves us.
This picture, taken with the joint Japanese Aerospace Exploration Agency/NASA observatory Hinode,
shows fierce activity above the Sun’s surface. Hot ionized gas flows
along the Sun’s towering magnetic field lines, forming
hundred-thousand-kilometer-long archs, giant loops, and … a heart? On
the right is a series of loops that, from Hinode’s angle, look very much
like a heart (I inset a clearer, rotated picture to make this more
obvious). Of course, this heart is glowing at a temperature of 8 million degrees Celsius, but maybe that’s just due to its magnetic attraction.
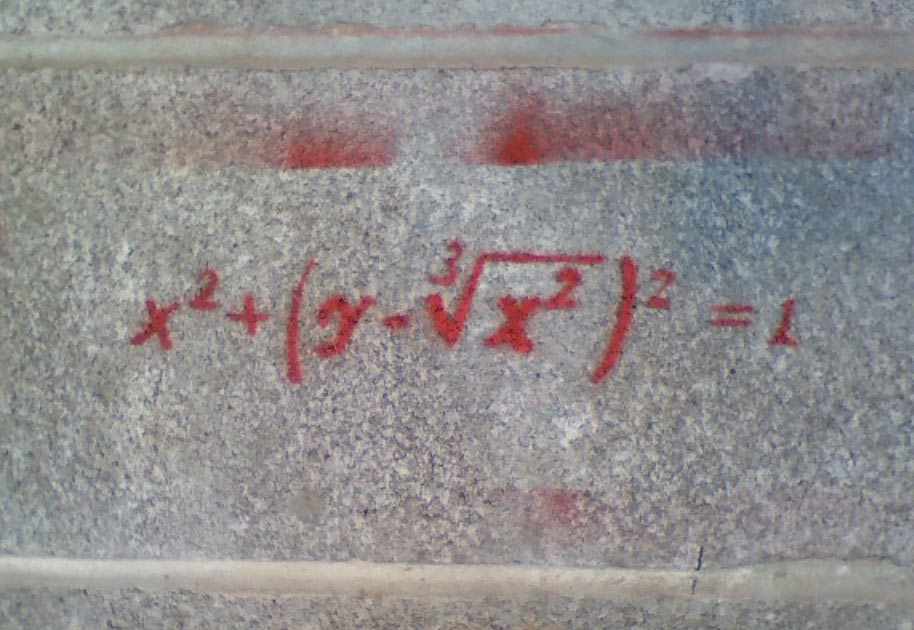
I have to leave you with this, somewhat enigmatic, picture. It was a
bit of graffiti spotted on a college campus. The photographer went to
the social networking site Reddit to ask what it meant ... and got the answer (some NSFW language there).
If you want to see what this equation represents, then go to the Wolfram Alpha site,
give it a second to do the calculation, then look for the graph labeled
“Implicit Plot.” You'll see which one I mean pretty easily. :)