Ruminations

Blog dedicated primarily to randomly selected news items; comments reflecting personal perceptions

Wednesday, April 15, 2026

Cancer Statisics for 2026 in Canada

"[Projected estimates] underscore the substantial impact cancer will continue to pose in Canada [in 2026]."
"Since the early 2000s, the incidence of pancreatic cancer has bee moderately increasing while no progress has been made in reducing mortality rates."
"Pancreatic cancer is expected to remain the third-leading cause of cancer-related death in 2026, with a similar number of males [3,400] and females [3,100] expected to die from the disease."
Research report, published in the Canadian Medical Association Journal
https://i.cbc.ca/ais/3c347bc4-6bba-44d0-baf3-994ffa5a4c42,1772071466628/full/max/0/default.jpg?im=Crop%2Crect%3D%280%2C0%2C1920%2C1080%29%3BResize%3D620
Doctors say Canada is facing a silent health crisis of HPV-related cervical cancer that could be prevented if more people got vaccinated against human papillomavirus, the virus that can cause the disease. Still from video, CBC
 
A mix of 'good' and 'bad' news comes out of a newly-published study on the state of  cancer in Canada, anticipating that diagnoses and mortality are expected to remain at 'high levels' in 2026. Survival rates are improving for a number of cancers, yet emerging trends for other types of cancer give cause for concern. The report's authors point out that at some point in their lives, close to half the country's population (42 percent) is forecasted to be diagnosed with some form of  cancer.
 
https://i.cbc.ca/ais/bde5df1c-0a65-415f-aa3a-240b927290a7,1776105259889/full/max/0/default.jpg?im=Crop%2Crect%3D%280%2C0%2C1920%2C1080%29%3BResize%3D620
To put it more plainly; an estimated 254,100 individuals will be diagnosed with some kind of cancer, while from among that number 87,900 will die in 2026, as an outcome of their cancerous condition. Lung, breast, prostate and colorectal cancers are identified as the most potentially diagnosed cancers; within that group, 47 percent of all cancers account for new cases estimated to be diagnosed throughout 2026. The third most common cancer killer behind lung and colorectal cancer has been named as pancreatic.
 
Higher risk of pancreatic cancer has been linked to excess body size; 49 percent of Canadian adults measure a waist circumference -- and abdominal fat -- that raises risk of pancreatic and other cancers, according to Statistics Canada. The incidence and death rates for colorectal cancer, common among both men and women, continues to fall, possibly as a result of increased screening related to colonoscopies and stool sample tests begun in the early 2000s. Incidence rates have diminished by 32 percent in men and 29 percent in women since then, given "the removal of pre-cancerous lesions and earlier diagnoses", along with improved  treatments. Concerns have been raised, however over under 50s being increasingly diagnosed with colorectal cancer. 
 
Lung cancer is expected, as the deadliest of all cancers for men and woman, to take 19,200 lives in  Canada in 2026. Lung cancer rates and deaths have been on the decline for males, only more recently among women when historically males were more susceptible to lung cancer, suffering greater deaths than women; a gap that has since been narrowed "over the last 40 years". In 2026, a greater number of women than men are in line to be diagnosed with lung cancers. "A higher proportion of lung cancers among females are not explained by tobacco consumption", according to the  report, suggesting there are risk factors that have yet to be addressed and studied. 
 
Radon gas is invisible, toxic & lurks in Cdn.homes
Exposure to radon -- a radioactive gas that cannot be seen or smelled -- is the second-leading cause of lung cancer in Canada, according to Statistics Canada; as well as the leading cause of cancer onset in non-smokers. Some one in five people in Canada live in homes posting radon levels at or above the guidelines, as reported by a national radon survey. 
 
Cancer remains the leading cause of death, accounting for 26 percent of all deaths in 2023 in Canada, also the leading cause of premature death especially for women. Among a number of 'concerning trends' is the rise of uterine and cervical cancer, following decades of decline. It has now risen "well above the World Health Organization's elimination target" of less than 4 cases per 100,000 women, while increasing among younger females. It is almost always caused by the HPV virus for which a vaccine is available, making it preventable. 
 
https://i.cbc.ca/ais/20033e0c-4ade-4937-aa1f-626c91d69c56,1773349955025/full/max/0/default.jpg?im=Crop%2Crect%3D%28678%2C0%2C607%2C1079%29%3BResize%3D343
Colorectal cancer screening
In the same token, the incidence of uterine cancer is expected to reach a state 53 percent  higher in 2026 than two decades earlier. Rising rates of obesity and women having fewer or no children, or delaying childbirth until they are older than what was previously the case. "The total number of cancer cases and deaths are expected to remain at high levels" resulting from the country's growing elderly population, wrote the researchers.
 
"On its own, lung cancer is expected to account for one in 5 cancer-related deaths in 2026."
"A higher proportion of lung cancers among females is not explained by tobacco consumption."
"[Canada's population grew by about 9.5 percent between 2020 and 2025, primarily due to immigration], and continues to age, with a record percentage (19.5 percent) of people aged 65 and older in 2025 [where the risk of cancer is elevated with age]." 
"[Advances in treatment translates to] a rapidly growing population of people living with and surviving cancer."
Research report  
 

Labels: , , , , ,

Thursday, January 22, 2026

Canadian Immigration, Population Growth

"Immigration is really fuelling not just population growth, but also the economy, because immigrants are generally younger than the average Canadian. The average Canadian now is  41, and immigrants tend to be younger."
"Now, because the religious composition of immigrants is so different from the religious composition of native-born people, we're seeing really fast increases in the Muslim community, in the Sikh community and the Hindu community, and this has really big implications for everything."
"I think that's part of the story about how immigration is changing Canada and Canadian families."
"This is the first time that I feel like all of Canada's problems aren't economic problems. They're actually demographic problems."
"When more money goes to support older people, we have less money for things that go to younger people. Like our daycare programs, our primary schools, our secondary schools, our labour force training programs, our universities, etc." 
Demographer and sociologist Rachel Margolis, Professor, Western University
 
"Canada has always been a country of diversity. We've always been a country with multiple nations, multiple languages, multiple ethnicities, multiple sources of newcomers."
"I don't think it's a matter of saying, 'Who is Canada?' It's some kind of plural version of the question: Who are Canadians?"
"I'm very interested in the 2026 census, whether we see a bigger share of newcomers, not only from India, but also from some of the African countries, such as Nigeria, Ghana or Tanzania, that also have highly educated populations and would be viable economic migrants."
"In Canada, religion has become an important variable that's at the centre of a lot of debates. So, if you look at, for example, some of the secularization legislation in Quebec, it's front and centre to public debates there."
"When we look at some of the discrimination that's been experienced over the last five years [or] post-October 7, as well as longer than that, 9/11, we see that religion becomes quite important and it often intersects with newcomers from different parts of the world." 
Political sociologist Howard Ramos, Professor,Western University 
https://smartcdn.gprod.postmedia.digital/nationalpost/wp-content/uploads/2026/01/Canada-census-demographics-faith-immigration-main-NU.jpg?quality=90&strip=all&w=1200&h=675&type=webp&sig=x4hugRS7t53iMBKobCUzeg
Older, 70% white, plunging fertility and lost faith: Who Canada is now, National Post
 
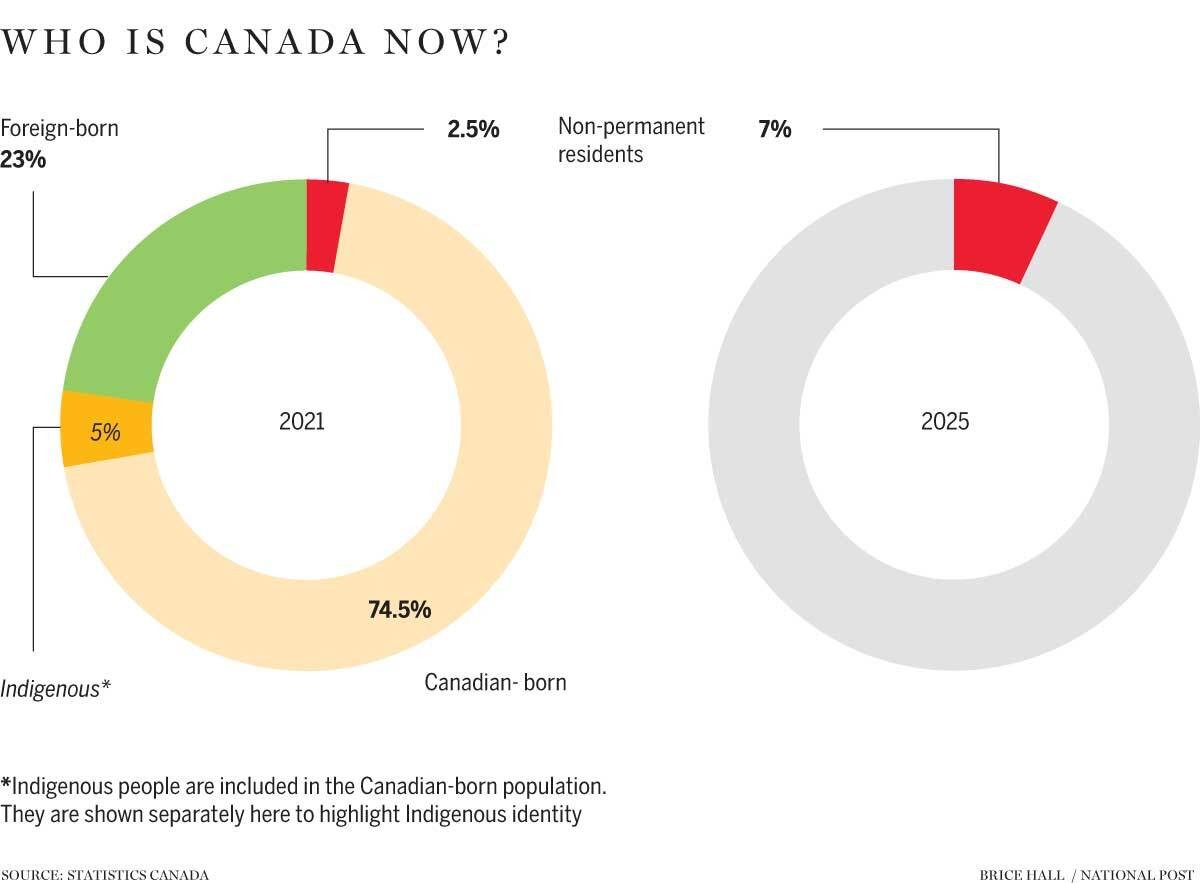
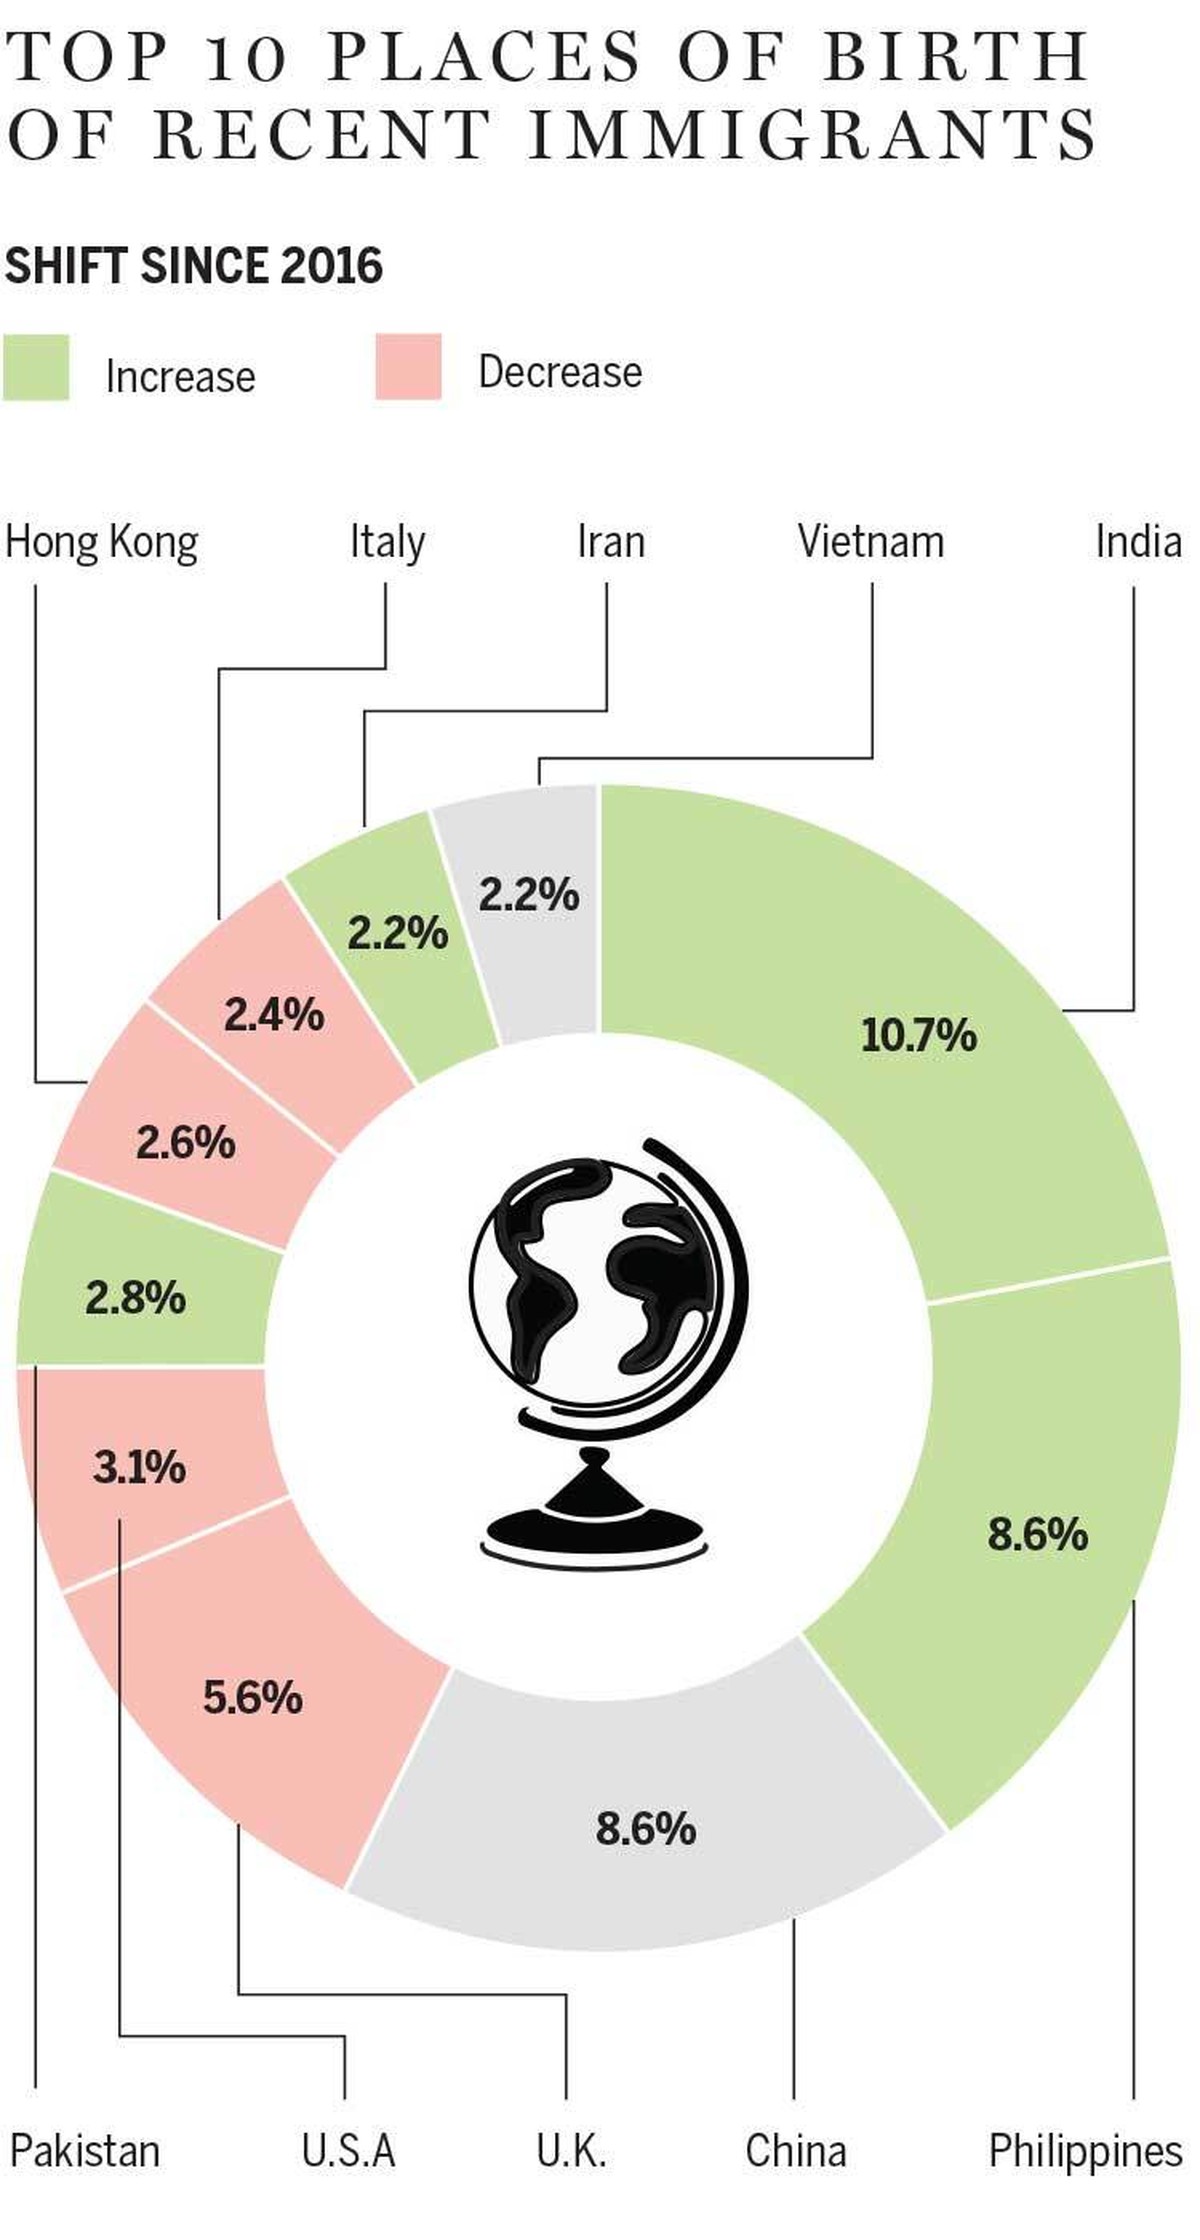
Canadian population growth is driven by immigration with close to one-quarter of the population being or having been a landed immigrant or permanent resident. This represents the highest intake of immigrants among the G7, as well as representing the largest share of immigrant intake since Confederation. Canada's 8.4 million immigrants are comprised thusly: India (10.7 percent), the Philippines (8.6 percent) and China (8.6 percent) as the top origins of birth. Immigration from Europe has declined in the last half-century (going from 61.6 percent in 1971 to 10.1 percent in 2021). 
 
New immigrants from Asia, on the other hand, inclusive of the Middle East has increased, with Asia now the leading continent of birth for new immigrants (62 percent), and India the top country of new immigrants; close to one in five (18.6 percent) having originated from India recently. India represents the lion's share of the 1.4 million South Asian immigrants, followed by Pakistan, Sri Lanka and Bangladesh. Of one million immigrants from South-east Asia, the Philippines is first, Vietnam following, then Malaysia, Cambodia and Thailand the top countries of origin.
 https://smartcdn.gprod.postmedia.digital/nationalpost/wp-content/uploads/2026/01/na0107-whoIsCanadaNow-07-BH-W.jpg?location=full_width&quality=90&strip=all&w=1200&type=webp&sig=bCFrqnX2na2za67br0rW5g
749,415 immigrants born in West Central Asia and the Middle East headed by Iran, followed by Syria, Lebanon, Iraq and Afghanistan, in that order as the top five countries of origin. Statistics Canada has recently released its latest report on the country's population and how it has been comprised with the immigration of global migrants. Canada now has 450-plus ethnic or cultural origins reporting for the latest census with the fastest population growth n the G7. What the statistics reveal is the shift in countries of origin with close to two-thirds of recent immigrants born in Asia, including the Middle East.
 
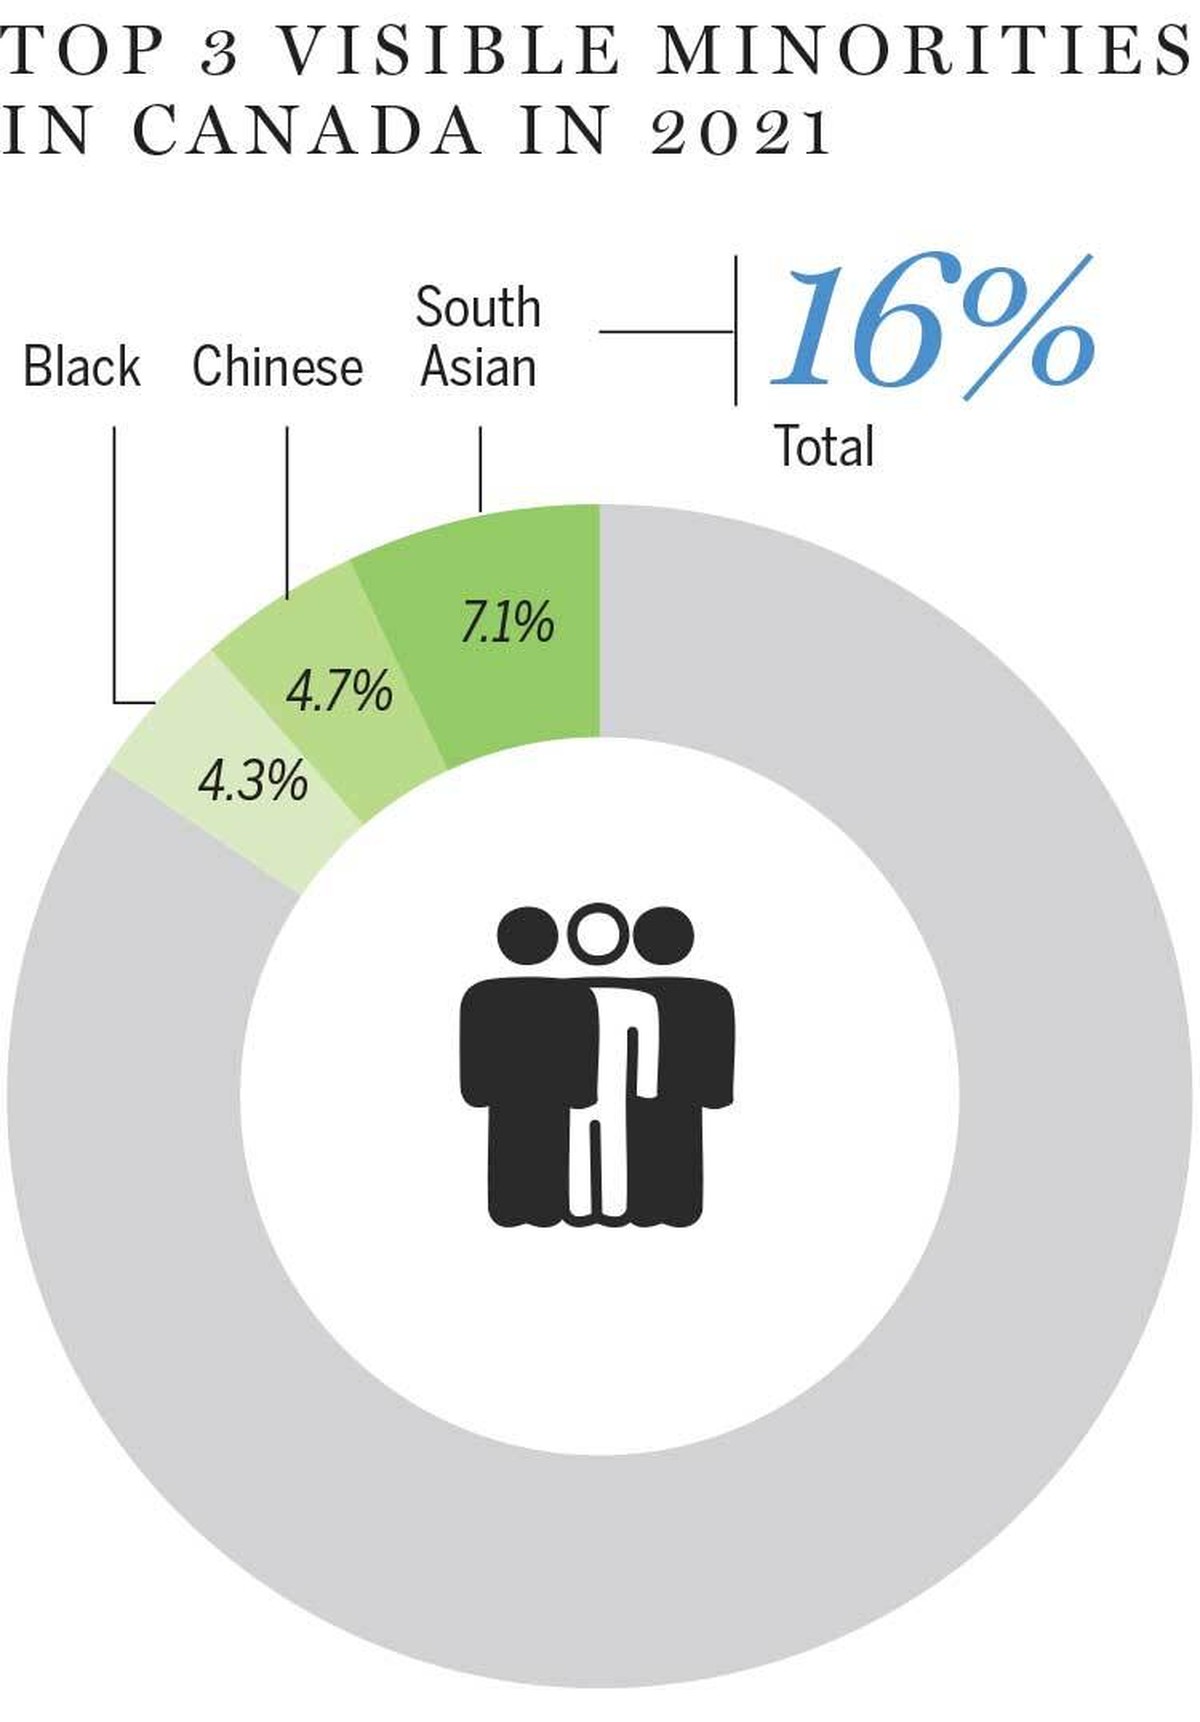
Over 95 percent of visible minorities domiciled in one of Canada's 41 large urban centres, with Toronto home to the largest populations of those of South Asian, Chinese, Black, Filipino, West Asian Latin American, South-east Asian and Korean derivation. The country's largest share of its new Arab population, at 35.5 percent of the group, settled in Montreal. There has been an eight percent increase in people identifying as First Nations, Inuit of Metis between 2015 and 2021, in comparison with 5.4 percent growth for the non-Indigenous population. 
 
https://smartcdn.gprod.postmedia.digital/nationalpost/wp-content/uploads/2026/01/np-chart-visibleMinorities.jpg?location=column&quality=90&strip=all&w=1200&type=webp&sig=cZobckHc7knunIGdp-HVag
Against a backdrop of Canadians losing interest in religious devotion, doubling in the last 20 years, most Canadians who are religious reported they are Christian; the numbers shrinking from 77.1 percent in 2001. Those identifying as Muslim (Islam being the second-most reported religion), Hindu or Sikh more than doubled in the past two decades. There has been a steady growth in numbers of Canada's aging population, the result now being that there are more Canadian seniors 65-plus (8.2 million), than there are Canadian children 14 and under (6.3 million). 
 
More than two in five (42.3 percent) of newborns in 2024 were of a foreign-born mother, according to a 2025 Statistics Canada study which pointed out that without immigration, Canada would have had negative population growth since 2022. In the most recent Canadian census over 450 ethnic and cultural origins were reported, 200 places of birth, 100 religions , and 450 languages. The country, once 97 percent Protestant and Catholic, has changed enormously.
 
In the last census about 335,000 people reported being ethnically Jewish, a smaller share of the population, as a result of population growth through immigration; their share in 2001 was 2.2 percent of the population, while in the two decades since it was reduced to 0.9 percent. The second-most common religion after Christianity -- one in 29 people reported being Muslim, at close to 1.8 million. Muslims rose from 2.0 to 4.9 percent of the population since 2001.  
"There's been a really big decline [in the fertility rate with a record low of 1.25 births per woman in 2024, as compared to a century earlier when Canadians on average had just over three children] just in the last 15 to 18 years."
"And the reason why that's important is that it took us from kind of low fertility to very, very low fertility. And the problem with very, very low fertility is that without large immigration, it leads to pretty rapid population decline and pretty rapid population aging, which changes the needs of where we put resources."
"[There's more freedom in how people choose to see their lives. Younger generations, they say they want few kids... They say it's less important for them to get married than it used to be. And I think that younger people feel more uncertain about what their path is."
Professor of sociology, Western University, Rachel Margolis  
https://smartcdn.gprod.postmedia.digital/nationalpost/wp-content/uploads/2026/01/np-chart-top10mmigration.jpg?location=half_width_right&quality=90&strip=all&w=1200&type=webp&sig=DXfitq7E6DYggpePMxYicw

The downside of this steady surge in population growth can be seen in Canada's universal health care system, hard pressed to provide timely and reliable health care to a growing population, with insufficient numbers of medical personnel, hospitals stressed to their coping limits and millions within the population without a primary health care provider. So too has the housing market been impacted; not enough houses and rentals to meet the demand, with rising prices for accommodation making it more difficult for young people to strike out on their own.

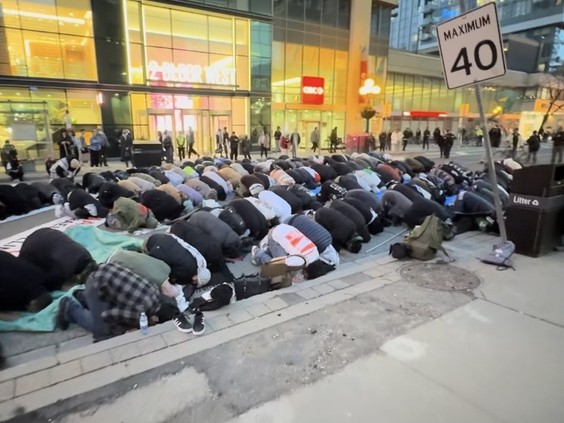
From within the large and still growing Muslim population a phenomenon of public protests against Israel and Jews has arisen, leading to an acute rise in antisemitism. Authorities at every level, while decrying rampant antisemitism have done little to uphold the law when 'pro-Palestinian' groups harass Canadian Jews, threaten their communities and vandalize Jewish businesses, synagogues and parochial schools. Mass Muslim public prayer sessions that block traffic and intersections have assaulted the Canadian social contract. 

https://smartcdn.gprod.postmedia.digital/torontosun/wp-content/uploads/2025/03/TS2025319JB059.TS_-e1742424265860.jpg?quality=90&strip=all&w=564&h=423&type=webp&sig=JPuu2XQoopNZ8S6AhQYu6w

The incidences of crime, youth crime, gun violence, car thefts, home break-ins has also increased, in part due to the formation of criminal gangs from within immigrant groups. The cost of living in Canada has also soared, making it difficult for many families to make ends meet. The use of Food Banks has increased exponentially, by foreign students, by economically stressed immigrant families, along with native-born in a depressed economy. Shelter use and homelessness has also been impacted by migrant groups arriving in Canada, awaiting the disposition of their claims for haven as refugees. 


Labels: , , , , ,

Sunday, June 02, 2024

Government Grant Programs Based on Metrics of Minority Issues

"[Some 58 percent of 1.5 million people living in poverty are white; what StatsCan refers to as] not a visible minority nor Indigenous."
"In other words, the overwhelming majority of the Canadian poor are 'white', and thus cannot receive race-based allocations from governments if unchangeable characteristics such as skin colour or ethnicity are accounted for in policy."
"Put another way, this funding would be inaccessible to 64 percent of those who are low-income, and of those who do qualify for the funding based on race, only 11.9 percent are low-income. This is not a sensible way to design an anti-poverty program."
Aristotle foundation: Poverty and Race in Canada: Facts about Race, discrimination, and the Poor 

"Anti-Black racism is manifested in the legacy of the current social, economic and political marginalization of African Canadians in society such as the lack of opportunities, lower socio-economic status, higher unemployment, significant poverty rates and over-representation in the criminal justice system."
Federal document 

"Systemic racism is not the cause of poverty in Canada."
"While some visible minority groups experience poverty in numbers disproportionate to the general population, it is also true that some visible minority groups are less likely to live in poverty, such as Canadians of Filipino, Southern Asian, and Latin American ancestry."
Study lead author and financial analyst Matthew Lau
https://multiculturalmeanderings.com/wp-content/uploads/2024/05/screenshot-2024-05-31-at-14.04.55.png?w=1024

Both the article and the report misrepresent the data as it looks at number living in poverty rather than the percentage of each group who are in poverty. For example, stating that 58 percent of white people living in poverty is less than their 74 percent of the Canadian population. Multicultural Meanderings


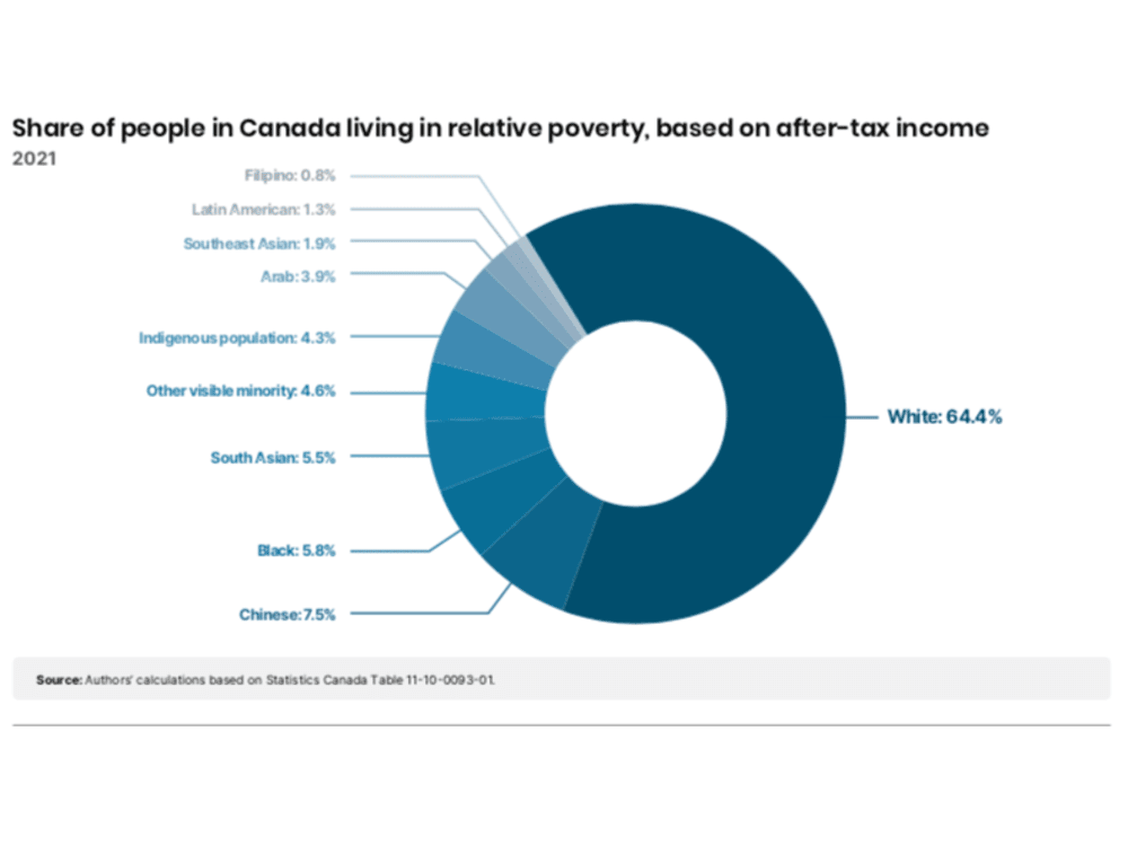
The study found between 7.4 and 10.6 percent of Canadians live in relative poverty, at the low end defined by low after-tax income, 58 percent, or 1.5 million people who live in poverty are white. The measurement of poverty is based on the cost of living, concluding that 2.5 million people; 64.4 percent of the group living in poverty are in fact white. The fact seems to be that the link between race and poverty justifying race-based remedies ignores many needy people.

The recently-published paper points out that government anti-poverty programs that come with racial qualifiers can misdirect resources benefiting those who fail to qualify as poor, but do as members of racial minorities. Ontario's Racialized and Indigenous Support of Entrepreneurs grant program which uses a low-income-after-tax measure for which eligibility would apply not only to 1.4 million low-income earners but as well close to 10.5 minorities/Indigenous not low-income. At the same time excluding non-minority non-Indigenous earners.

Some minority groups in Canada, the study found, are as likely (in some cases less likely to be poor) compared to white Canadians. These minority groups encompass Canadians of Japanese, Korean, South Asian and Chinese ancestry with higher average weekly earnings than their white counterparts. Delinking poverty from race, suggests the study, should address "root issues" of poverty through strengthening or minimizing interference with the "success sequence": the formula of completing high school, full-time work and marriage prior to having children.

Markers, the study recommends that predicate a non-poverty life for most people in North America.
"Poverty is colour-blind, and thus poverty policy which excludes some Canadians and favours others based on colour or ethnicity omits a vast swath of the poor in Canada, in addition to being illiberal."
"The focus of anti-poverty policy in Canada should instead be focused on the individuals in need and on creating widespread opportunity for all."
Study co-author, David Hunt, research director, Aristotle Foundationhttps://smartcdn.gprod.postmedia.digital/nationalpost/wp-content/uploads/2024/05/Screen-Shot-2024-05-30-at-11.53.05-AM.png?quality=90&strip=all&w=1128&h=846&type=webp&sig=q37BnOFn75HCPvLTW3jDsQ

Labels: , , , , ,

Monday, February 21, 2022

Shattering Social Assumptions

"Descriptive studies like this are like paintings -- different people will see different things in the numbers."
"But the reality is that what lies behind the earnings differences reported is nuanced, complex, and largely unknown."
"It's almost a fundamentally unidentified problem. [Rather then automatically believing gaps in earnings and education to be rooted in] injustice or unfairness [it is important to remember] people make different choices."
Mikal Skuterud, economist, University of Waterloo
 
"[The report set out to measure weekly incomes of Canadian-born people between the ages of 25 to 44 in 2016, a census year, based on a dozen visible minority categories. as a setting for the country's Anti-Racism Strategy, committed to] removing barriers and promoting a country where every person is able to fully participate and have an equal opportunity to proceed."
"Only about one in twenty [visible minority members] live in smaller cities, towns and rural areas, compared with about one in three white people." 
StatsCan Report, Theresa Qiu and Grant Schellenberg
People of colour born in Canada are more likely than white people to have university degrees. That contributes to higher earnings.
Statistics Canada has issued its latest report emanating from research on ethnic groups, focusing on earnings and educational achievements. Their results challenge the fairly universal social belief in discrimination in the workplace against visible minorities and people from ethnic minorities holding back advancement. What the report points out is that earnings vary widely for each ethnic cohort studied; some groups clearly flourishing, and others struggling to attain earnings parity.

Those of South Korean, Chinese and South Asian heritage appear to represent the top echelon of earners in Canada by and large, while Latin-American and Black groups tend to be among the lowest earners. Whites, on the other hand, are stuck for the most part in the middle of the pack with respect to wages and surprisingly enough are in the lower echelons regarding university education.

Such details, according to economist Frances Woolley of Carleton University, are critical to understanding the situation pertaining to achievement in both these areas regarding visible minorities. The federal Employment Equity Act places visible minorities as one of four groups covered; women, people with disabilities and Indigenous Canadians, make up the other three.

White Canadians were used as a majority baseline, enabling the report to pinpoint that some ethnic groups are performing significantly better than others in earnings and education. Striking differences between men and women is examined as is how people of colour tend to overwhelmingly choose to live in major cities in Canada.

The report also gently turns the table on preconceptions over outcomes being directly responsible by the presence in workplaces and educational opportunities by racist workplace supervisors or discriminatory educators. Outcomes in both areas are far more likely to be the result of complex life decisions people tend to make, for those people who fail to move up the ladder of opportunity.

According to the report, most visible-minority Canadian women earn more than do white females, whose average was $1,120 weekly. Korean-Canadian women earned $1,450 a week while Chinese women earned $1,440; South Asian women $1,360;and Arab and Iranian women, $1,120. Black women on the other had, earned less, at $1,080, and Latin-American women made $1,000 a week.

Slightly more was earned by Korean, Japanese and South Asian men than white males, who took in $1,530, while Chinese-Canadian men earned about the same and Filipino and South-East Asian men earned roughly 15 percent less than white males, and Latin-Americans and Black males earned about 20 percent less.

When variables such as age, place of residence and educational levels are taken into account, other issues remain significant. The Statistics Canada report makes no suggestion where discrimination might be occurring in Canada, but both Schellenberg and Skuterud feel the data appears to raise at minimum one red flag: Black males fell further behind others in earnings in the period between 2006 and 2016.

Another surprise: People of colour born in Canada are likelier than are white people to gain university degrees. Over 60 percent of Chinese and Korean men earned a bachelor's degree at the very least, or  higher, in comparison to 24 percent of white males, a gulf in educational attainment considered "astonishing", by Dr.Skuterud. Over 40 percent of South Asian, Arab, West Asian and Japanese men sought and gained university degrees.

The only ethnic groups less likely to have degrees as compared to white males were Black males, at 20 percent, and Latin-American males at 17 percent. And then there is the different lifestyle choices made by people of colour and whites, where 60 percent of all people of colour in Canada choose to live in just three cities; Montreal, Toronto and Vancouver, in comparison to a mere 27 percent of white people.

One reason many people of colour earn more than do white people, is the very fact that they live in metropolises where wages tend to be higher. White people, found the authors, were also likelier to be married, have children and not be living with their parents. U.S. research in particular has explored whether employers discriminate based on race or ethnicity, despite which, Dr.Skuterud points out "It's almost a fundamentally unidentifiable problem."

Sixty per cent of all people of colour in Canada live in just three cities — Montreal, Toronto and Vancouver — where wages are generally higher. That compares to only 27 per cent of white people.
Sixty per cent of all people of colour in Canada live in just three cities — Montreal, Toronto and Vancouver — where wages are generally higher. That compares to only 27 per cent of white people. Photo by KENA BETANCUR /AFP via Getty Images

Labels: , , , , , ,

Monday, September 09, 2019


Cannabis Bashful? Acquisition from Illegal Sources?

"Over the past two years, Statistics Canada has been working to update its statistical programs to better capture the social and economic impacts related to the legalization of cannabis, which took place on October 17, 2018, and to the misuse of opioids and other drugs with higher risk of being abused. Accurate measures of total societal use of cannabis and misused drugs are difficult to obtain." "The stigma associated with use and reluctance to disclose purchases from non-regulated suppliers are two factors that could contribute to some under-reporting on surveys. To support the survey-based data, Statistics Canada is exploring the use of a technique called wastewater-based epidemiology (WBE), which has been used in Europe since 2007 to report on the consumption of different types of drugs in large cities (European Monitoring Centre for Drugs and Drug Addiction, 2016)."
"In March 2018, the agency implemented a pilot project to collect and test municipal wastewater samples for traces of cannabis, and a dozen other drugs to examine if the resulting data could be used to make estimates of the extent of drug use in different cities across Canada and change in use over time. The pilot test is the largest ever conducted in North America in terms of population covered. The advantages of this technique include its low cost, timeliness, the ability to monitor change over time at the city level, and importantly, the potential to determine the total amount of a drug consumed, whether legally or illegally acquired. One limitation of this approach is that it does not provide information on the number or characteristics of individuals who consumed or how the drugs were consumed, but Statistics Canada uses other surveys to help determine these more detailed data."
"The pilot project covered 14 wastewater treatment plants in five large urban centres across the country, and serving close to 8.4 million people, which is over 20% of the Canadian population (Table 1). Wastewater from each site was sampled at least every 30 minutes for seven consecutive days starting on the second Monday of each month, from March 2018 to February 2019."
"It is possible that the consumption per user could be greater. It is also possible that cannabis use in Montreal is measurably higher than for the rest of Quebec."
Statistics Canada, Wastewater report
Wastewater Pilot-Test Design Table summary
This table displays the results of Wastewater Pilot-Test Design. The information is grouped by Test Site (appearing as row headers), Wastewater Treatment Plants and 2018 Population
(millions of people) (appearing as column headers).
Test Site Wastewater Treatment Plants 2018 Population
(millions of people)
Central Halifax 3 0.2
Montreal Island 1 2.0
Toronto City 4 2.8
Edmonton City 1 1.0
Vancouver metro area 5 2.5
Total 14 8.4
Wastewater samples have been collected from five cities in Canada to search for traces of cannabis in an effort to gauge the actual use of the drug through collecting, and testing the evidence in wastewater. The results were found to be somewhat unexpected; on the one hand they were the opposite of other data collected by Statistics Canada on pot use. On the other hand, it became clear that the size of the black market access to drugs appeared to be higher than anticipated.

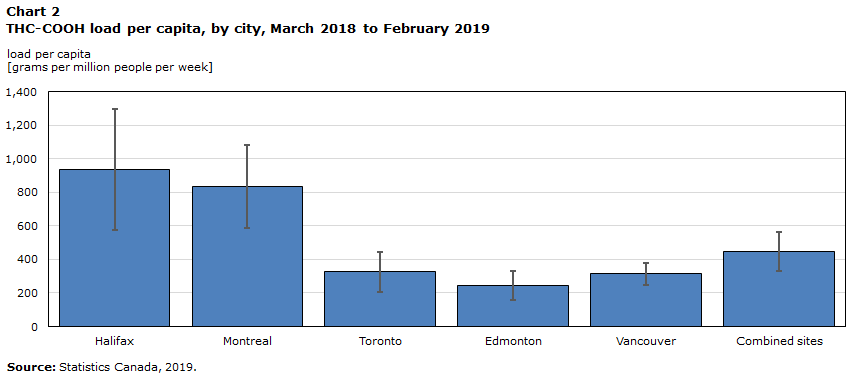
The human body converts THC into THC-COOH, when cannabis is consumed. The resulting chemical can be measured in wastewater, otherwise known as sewage. Halifax, as it turned out, had the highest average load of THC-COOH per capita of the five cities that were measured between March 2018 and February 2019. Then came Montreal, followed by Toronto, Vancouver and Edmonton.

Statisticians were not surprised to find that residents of Halifax excrete more cannabis residue than users of any other Canadian city, given that the National Cannabis Survey associated with Statistics Canada found 24 percent of Nova Scotians self-reported the use of pot in the second quarter, representing the highest use of any province.

What was unexpected however, is the high level of the chemical residue in Montreal's wastewater since  a mere ten percent of Quebecers felt free to report cannabis use in the second quarter, representing the lowest score of any province. The low wastewater results for Edmonton also appear perplexing, since Alberta had the third-highest reported cannabis use at 20 percent.

This inexact science of having people self-report is obviously behind the failure of people's admissions of use not matching the actual tested samples in the various cities' wastewater pools. It would seem that, factors beyond simple cannabis use per capita could be skewing the results, allowing for the fact that people are notoriously reluctant to divulge their use of a mind-altering drug which, though now legal, still has a social stigma attached to its devoted  use.


Chart 2: THC-COOH load per capita, by city, March 2018 to February 2019


Labels: , ,

Saturday, February 09, 2019

Challenging Illegal Cannabis

"Numbers show that 16 per cent of Albertans, aged 15 and older, have consumed marijuana in the last three months, down from 17 per cent reported between Aug. 16 and Sept. 12 — shortly before marijuana became legal in Canada on Oct. 17. The national average of consumption, according to Statistics Canada, is around 15 per cent."
"Maritimers continue to light up more than the rest of the country, with just below 22 per cent of Nova Scotians who have reported consuming marijuana in the last three months leading the pack. Newfoundlanders are trailing just behind at 19 per cent, followed by New Brunswick at 18.9 per cent, and Prince Edward Island at 17.9 per cent."
"Alongside Alberta, British Columbia has also seen a slight decrease in reported marijuana consumption — albeit more significant: around 15 per cent reported smoking weed in the last three months after legalization, versus 20 per cent who reported using cannabis just before. Manitoba has also seen a decrease, with 15 per cent reporting use of marijuana, down from 19 per cent before legalization"
thestar.com National Logo
A vendor displays marijuana for sale in Vancouver, B.C. Statistics Canada data shows that marijuana consumption has relatively stayed the same since legalization, and dropped in British Columbia and Manitoba.
A vendor displays marijuana for sale in Vancouver, B.C. Statistics Canada data shows that marijuana consumption has relatively stayed the same since legalization, and dropped in British Columbia and Manitoba.  (Darryl Dyck / The Canadian Press file)

A national cannabis survey was released on Thursday by Statistics Canada which found that non-medical cannabis users were less likely to obtain their cannabis legally. Surprising, since of course when the federal government brought in legalization of recreational cannabis in October of 2018, to great self-congratulatory plaudits, it emphasized that this would set the death knell to the illegal sale of marijuana while at the same time legal sales would ensure that pot wouldn't be getting into the hands of minors.

What the survey brought to light was, without doubt, surprising. Only 26 percent of non-medical cannabis users claimed to have purchased cannabis from authorized retailers or online producers. Of course some of this expectation lag can be attributed to the initial roll-out of the new system, where provinces are in various stages of authorizing legal pot outlets and where even government-approved sales outlets have been faced with product shortages from producers.

Still, according to Stats Canada, 42 percent of non-medical users state the cannabis they use has been illegally obtained; through drug dealers, or for example compassion clubs, unlicensed dispensaries or storefronts, or through unlicensed websites. Somewhat adverse to the claims by the federal government that the illicit drug trade would become extinct and in the final analysis, public safety would be greatly enhanced.
Statistics Canada’s national cannabis survey also revealed that 42 per cent of non-medical users say they obtained cannabis illegally, such as through drug dealers, compassion clubs, unlicensed dispensaries or storefronts, and unlicensed websites.
Statistics Canada’s national cannabis survey also revealed that 42 per cent of non-medical users say they obtained cannabis illegally, such as through drug dealers, compassion clubs, unlicensed dispensaries or storefronts, and unlicensed websites.  (Tijana Martin / THE CANADIAN PRESS)

The statistics-gathering agency of the Government of Canada is doing its work, maintaining track on the use, sales and prices of the product. The agency a month earlier reported the average price of a legal gram of medical or recreational marijuana in the fourth quarter of 2018 to be $9.70, while the black market price was ... $6.51. Old habits die hard, and they die harder when there is a sizzling price differential involved.

A third of consumers spent nothing on the marijuana they consumed, presumably because they also grew it themselves, also legal under the law ... which permits four plants to be grown in a home. Over $500 was claimed to have been spent by roughly 8 percent of respondent users, about $40 weekly, consistent according to Statistics Canada, with the spending pattern seen in the previous quarter.

According to consumers, quality and safety of product is uppermost in mind in deciding where to purchase. Price and accessibility are secondary, evidently.

Close to one in five Canadians (19 percent) plan to use cannabis in the next three months, representing a higher number than those reporting use at the present time. Oddly enough, fewer people appear to be using now than before legalization. For the present, however, 4.6 million or 15 percent of the population of Canadians over age 15 has reported using cannabis in the past three months; one quarter for medicinal reasons, the rest for non-medical use.

Cannabis use (%)
Fourth quarter 2018

Canada    15.4
Newfoundland and Labrador    19.2
Prince Edward Island    17.9
Nova Scotia    21.6
New Brunswick    18.9
Quebec    13.6
Ontario    15.4
Manitoba    15.1
Saskatchewan    16.5
Alberta    16.2
British Columbia    15.3


Cannabis use in the past three months by gender, Canada
Male    19.4
Female    11.3


Cannabis use in the past three months by age, Canada
15 to 24 years    27.4
25 to 34 years    23.2
35 to 44 years    17.5
45 to 54 years    12.8
55 to 64 years    10.4
65 years and over    5.2

Source(s): Statistics Canada, table 13-10-0383-01.


Labels: , ,

 
()() Follow @rheytah Tweet